
How Will AI Transform Partial Discharge Diagnostics?
Send your test requirement — get a tailored solution and a quote within one working day.
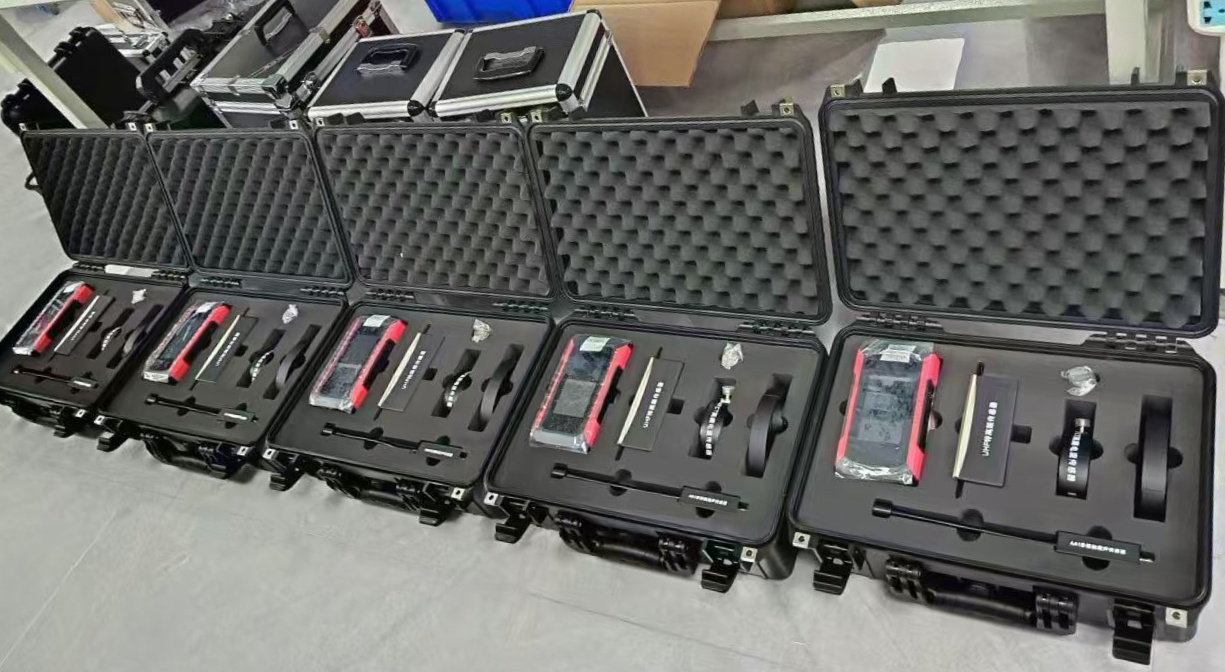
AI will make partial discharge diagnostics faster, more consistent, and increasingly automated by recognizing defect patterns, separating electrical noise, ranking risk, and recommending targeted inspections. However, 99% accuracy is achievable only in tightly controlled and well-labeled datasets; real substations require asset-specific training, multiple sensors, confidence scoring, and engineer validation before maintenance decisions are made.
The AI Future of Predictive Maintenance through PD Monitoring
What Is AI-Based Partial Discharge Diagnosis?
AI-based partial discharge diagnosis uses machine learning models to analyze PD signals, phase-resolved partial discharge patterns, pulse shapes, frequency content, time sequences, and sensor data. The system classifies likely insulation defects, filters interference, and prioritizes assets for human review.
Partial discharge is a localized electrical discharge that only partly bridges insulation. It can occur inside voids, along contaminated surfaces, at sharp metallic points, around loose connections, in cable accessories, transformer insulation, GIS, switchgear, bushings, and rotating machines.
Traditional PD diagnosis depends heavily on an experienced engineer interpreting:
- Apparent charge or pulse magnitude.
- Pulse repetition rate.
- Phase-resolved partial discharge, or PRPD, patterns.
- Pulse polarity and phase position.
- Frequency spectrum.
- Time-of-flight information.
- Sensor location and coupling path.
- Background noise and electromagnetic interference.
AI does not remove the need for these measurements. It turns them into structured digital inputs that can be compared against large libraries of verified defect signatures.
The strongest future systems will not ask, “Is this PD?” only once. They will evaluate whether the signal is electrical interference, a genuine discharge, a likely defect family, a developing issue, or a condition requiring immediate inspection.
How Does Machine Learning Identify PD Fault Patterns?
Machine learning identifies PD fault patterns by learning relationships between labeled signal features and known defect types. It can analyze PRPD images, raw pulses, time-frequency maps, acoustic signals, UHF signals, and operating data to distinguish internal discharge, surface discharge, corona, floating-potential activity, and noise.
The typical process begins with data collection. A PD monitoring system captures synchronized signals from one or more sensors. These may include conventional electrical couplers, UHF sensors, high-frequency current transformers, transient earth-voltage sensors, ultrasonic probes, or optical sensors.
The system then extracts useful features, such as:
- Pulse amplitude distribution.
- Positive and negative half-cycle balance.
- Phase angle of pulse occurrence.
- Pulse count per cycle.
- Repetition-rate changes.
- Frequency-band energy.
- Rise time and pulse width.
- Cross-sensor arrival-time difference.
- Temperature, humidity, voltage, and load correlation.
A simpler model may use manually selected statistics and classify signals with decision trees, support-vector machines, or clustering methods. A more advanced model may use convolutional neural networks to interpret PRPD images directly, or sequence models to track changes over time.
In controlled datasets, published research has reported PD classification results above 97% for selected defect categories. Those figures are useful indicators of potential, but they are not a universal guarantee for every transformer, cable system, GIS bay, or outdoor switchgear installation.
Why Is 99% Accuracy Not a Universal Field Guarantee?
A 99% AI accuracy claim is meaningful only when the defect classes, sensors, noise conditions, asset types, and validation dataset are clearly defined. Field performance can be lower when the system encounters new interference sources, overlapping PD mechanisms, changed sensor placement, or defects absent from training data.
Accuracy is often misunderstood during purchasing discussions. A model may identify four laboratory-created PD classes with 99% accuracy while struggling in an operating substation where the data includes inverter switching noise, corona from nearby hardware, radio interference, loose grounding, and multiple simultaneous PD sources.
A technically useful AI diagnostic system should report more than one confidence number. It should show:
- Probability that the event is genuine PD.
- Probability of each defect category.
- Sensor agreement or disagreement.
- Trend direction over time.
- Similarity to known training patterns.
- Whether the signal is outside the trained data range.
- Recommended human verification step.
In our manufacturing and application work, the most valuable result is often not an automatic defect label. It is a correctly prioritized warning that says: “This asset has a new, repeatable, phase-related pattern with rising activity and high confidence that it differs from normal background noise.”
That message enables the maintenance team to inspect the right bay, cable joint, bushing, or transformer compartment before the condition escalates.
Which PD Data Improves AI Diagnostic Accuracy?
AI diagnostic accuracy improves when systems combine clean, labeled PD data with operating context, multi-sensor confirmation, synchronized acquisition, and repeat measurements from real assets. A model trained only on ideal laboratory patterns cannot fully represent field-installed equipment.
The data quality requirements are often more important than the choice of algorithm. A modern neural network cannot correct a poor sensor installation, an unsynchronized timestamp, a mislabeled fault, or an incomplete operating record.
| Data input | What AI can learn | Field value |
|---|---|---|
| PRPD pattern | Phase distribution, polarity, repetition characteristics | Separates common defect families and interference patterns |
| Raw pulse waveform | Rise time, bandwidth, pulse shape, reflection behavior | Helps distinguish PD from switching noise |
| UHF or HFCT channels | High-frequency event signatures and arrival timing | Improves noise rejection and location comparison |
| Ultrasonic signals | Acoustic emission intensity and timing | Supports localization in transformers and switchgear |
| Asset operating data | Load, temperature, voltage, humidity, tap position | Identifies condition-dependent PD behavior |
| Historical trends | Growth rate, intermittency, recurring patterns | Supports condition ranking and maintenance planning |
| Inspection outcomes | Verified defect labels and repair results | Builds a stronger local training database |
A practical example is a 24 kV switchgear line-up monitored by transient earth-voltage and ultrasonic sensors. A single TEV sensor may record repeated pulses that resemble internal PD. When the pulse has no matching ultrasonic signature, no phase stability, and occurs only when a nearby variable-speed drive operates, the AI should lower its PD confidence rather than create an urgent alarm.
Wrindu is developing diagnostic workflows that treat sensor agreement and operating context as essential inputs. Automated classification is strongest when it combines evidence rather than relying on one waveform image.
How Can AI Separate Partial Discharge From Noise?
AI separates PD from noise by comparing phase behavior, pulse shape, frequency content, repetition rate, sensor location, and time correlation against learned signal patterns. Multi-sensor validation improves reliability because real PD and external interference usually propagate differently through an electrical asset.
Noise is the largest practical obstacle in PD monitoring. In industrial and utility sites, common interference sources include switching power supplies, corona from overhead conductors, radio transmitters, inverter drives, PLC signals, poor grounding, loose metallic parts, and neighboring high-voltage equipment.
A reliable automated system should use layered screening:
- Detect pulses above the sensor and acquisition threshold.
- Group pulses by waveform and time similarity.
- Check phase relationship to the power-frequency cycle.
- Compare signal arrival across sensors.
- Reject repeating external noise signatures.
- Classify remaining clusters by defect likelihood.
- Trend the confirmed or probable PD population separately.
One important factory lesson is that aggressive filtering can create a false sense of cleanliness. If filters are set too tightly, the system may suppress low-level but persistent discharge activity. If filters are too loose, the dashboard becomes overloaded with irrelevant events.
The correct target is not the lowest visible pulse count. It is the best separation between meaningful defect activity and interference.
What PD Defects Can AI Classify Automatically?
AI can classify recurring PD patterns associated with internal void discharge, surface discharge, corona, floating electrodes, loose connections, insulation tracking, cable-accessory defects, and some forms of external interference. Classification is most reliable when the defect pattern is distinct and represented in the training data.
The relationship between a pattern and a physical defect is not always one-to-one. Surface discharge on a contaminated insulator, for example, may resemble other phase-related activity when the signal path, voltage waveform, and sensor type differ.
For this reason, the best systems use classification categories that reflect practical maintenance action:
- Probable internal insulation defect.
- Probable surface or tracking activity.
- Probable corona or sharp-point discharge.
- Probable floating-potential or loose-metal condition.
- Probable external interference.
- Unclassified but abnormal activity.
- Sensor or acquisition issue.
This approach is safer than claiming a precise internal fault mechanism from limited data. It also creates a practical work order pathway. “Probable external interference” may lead to grounding and electromagnetic survey work. “Probable internal defect with increasing activity” may lead to outage planning, localization, and targeted inspection.
Research and field trials indicate that deep-learning methods can produce strong defect-classification results from PD datasets, particularly when patterns are clearly defined and training data is sufficient. Yet practical systems still require standardized, explainable, and field-deployable approaches for real-time classification.
Can AI Predict PD Failure Before an Outage?
AI can estimate increasing PD risk and identify abnormal trends before an outage, but it cannot reliably predict the exact date of insulation failure without asset-specific evidence. PD severity, defect location, insulation type, load stress, environment, and maintenance history all affect how quickly damage develops.
A single high-amplitude event may be less urgent than a lower-amplitude pattern that grows consistently over months. The most useful predictive model tracks change, not just magnitude.
A condition-ranking model can consider:
- Increase in pulse count per hour or per cycle.
- Growth in pulse magnitude or energy.
- Expansion of phase-resolved pattern width.
- New activity at different voltage or load levels.
- Movement of a defect toward more severe classes.
- Agreement across multiple sensors.
- Comparison against fleet baselines.
- Confirmed prior failures in similar assets.
For example, a cable termination may show stable low-level activity for six months. If the pattern begins appearing across a broader voltage range, repeats more frequently during wet periods, and gains confirmation from a second sensor, the AI should raise the condition score even if peak amplitude remains unchanged.
The goal is not to replace the engineer’s judgment. It is to identify which asset deserves attention first when hundreds of monitored points compete for limited maintenance resources.
How Should Factories Build AI-Ready PD Equipment?
Factories should build AI-ready PD equipment with stable sensors, synchronized sampling, repeatable calibration, high-quality waveform capture, secure data storage, configurable thresholds, and exportable records. Hardware consistency is essential because AI performance depends on comparable data across instruments and installations.
A machine-learning model cannot perform reliably if the input changes unpredictably from one device batch to another. Sensor bandwidth, gain, noise floor, triggering behavior, timestamp accuracy, and signal conditioning must be controlled.
In production runs, we have seen that small hardware inconsistencies can matter. A 6 dB change in front-end gain, a different anti-aliasing filter, or a poorly shielded sensor cable can shift the apparent signal distribution enough to confuse a model trained on earlier data.
For AI-ready design, a manufacturer should control:
- Sensor sensitivity and frequency response.
- Channel-to-channel gain consistency.
- Sampling rate and waveform length.
- Trigger threshold and pre-trigger capture.
- Time synchronization between channels.
- Electromagnetic shielding and grounding design.
- Temperature stability of the analog front end.
- Firmware version control.
- Calibration and self-check procedures.
- Secure local and cloud-compatible data formats.
Wrindu, as a China manufacturer and OEM supplier of high-voltage diagnostic equipment, focuses on creating dependable measurement foundations before adding automation layers. The quality of the AI output can never exceed the quality of the signal entering the instrument.
Who Benefits From Automated PD Diagnostics?
Utilities, substations, cable-network operators, renewable plants, industrial facilities, rail systems, transformer manufacturers, switchgear OEMs, testing laboratories, and maintenance contractors benefit from automated PD diagnostics because AI can reduce review time and help teams focus on the highest-risk assets.
The benefits vary by user group:
- Utilities can prioritize large fleets of transformers, GIS, switchgear, and cable circuits.
- Renewable plants can monitor dispersed assets where routine manual inspection is difficult.
- Industrial facilities can identify insulation risks before a process shutdown.
- Rail operators can improve availability of traction substations and cable networks.
- OEM manufacturers can use automated pattern review during factory tests and quality investigations.
- Service companies can deliver faster reports while preserving raw waveform evidence.
For distributors and system integrators, China factory supply becomes more valuable when the manufacturer can provide stable hardware, application support, custom software workflow, multilingual reports, and OEM configurations rather than only a generic PD detector.
Wrindu supports standard, custom, OEM, and wholesale PD diagnostic projects for customers who need hardware adapted to their sensor architecture, monitoring location, reporting requirements, and future data-analysis plans.
What Are Wrindu Expert Views on AI PD Diagnostics?
“AI should not be treated as a black-box alarm generator. Its first job is to organize thousands of pulses into evidence an engineer can act on: which sensor saw the event, whether it is phase-related, whether another channel confirmed it, how it changed over time, and how closely it matches known patterns. In our development work, a model that correctly flags uncertainty is more valuable than one that confidently assigns a defect label beyond its training range. The path to high accuracy begins with repeatable hardware, verified field labels, and disciplined trend data.”
— Wrindu Technical Applications Team
When Should AI Trigger Human Review?
AI should trigger human review when PD activity rises rapidly, a new phase-related pattern appears, multiple sensors confirm the event, confidence is low due to unfamiliar data, the signal is associated with critical equipment, or the system detects a conflict between automated classification and operating conditions.
Not every event requires an outage. A practical escalation workflow can separate conditions into three levels:
- Monitor: Low and stable activity with likely noise or low-confidence classification.
- Investigate: Repeatable phase-related activity, unusual patterns, or increasing trend.
- Act urgently: Strong multi-sensor confirmation, rapidly escalating activity, insulation-risk pattern, or a condition linked to critical equipment.
The review should include raw waveform checks, PRPD plots, sensor placement verification, current loading, voltage conditions, temperature, humidity, maintenance history, and any recent switching or fault events.
This process allows AI to save time without allowing automation to hide uncertainty.
How Can Buyers Choose an AI-Ready PD Supplier?
Buyers should choose an AI-ready PD supplier by evaluating sensor quality, acquisition stability, data ownership, classification transparency, training-data relevance, integration capability, calibration controls, and technical support. Do not select a system solely because it advertises a high classification percentage.
Ask suppliers to demonstrate how the system handles:
- Genuine PD versus electrical noise.
- Multiple simultaneous PD sources.
- New signals outside the trained dataset.
- Low-level but growing activity.
- Sensor failure or changing background noise.
- Data export and long-term file access.
- Model updates and firmware compatibility.
- On-premises versus cloud processing.
- OEM branding and custom report requirements.
- Field validation against known defects or post-maintenance findings.
A capable supplier should explain when the AI is confident, why it reached a conclusion, and what evidence supports the recommendation. The supplier should also retain the raw data needed for independent engineering review.
For B2B buyers, Wrindu provides factory-direct collaboration for PD diagnostic instruments, customized sensor inputs, OEM solutions, wholesale programs, and application-oriented technical support.
What Are the Key Takeaways?
AI will make PD diagnostics more scalable by classifying recurring patterns, rejecting noise, tracking deterioration, and directing engineers toward the assets that require attention. High laboratory accuracy is promising, but real-world success depends on representative data, reliable sensors, synchronized acquisition, transparent confidence scoring, and human verification.
Use these actions when planning automated PD diagnostics:
- Start with stable, well-installed sensors and repeatable acquisition hardware.
- Capture raw waveforms and PRPD data, not only simplified alarm values.
- Build a verified database using inspection and maintenance outcomes.
- Use multiple sensors whenever asset design and budget allow.
- Treat 99% accuracy as a dataset-specific performance target, not a blanket field promise.
- Require transparent confidence scores and access to raw diagnostic evidence.
- Select a China manufacturer that can support custom, OEM, wholesale, and long-term system development.
AI will not eliminate PD specialists. It will give them faster evidence, stronger fleet visibility, and more time to make the critical maintenance decisions that protect high-voltage assets.
FAQs
Can AI detect partial discharge automatically?
Yes. AI can automatically detect and classify PD-like patterns when it receives sufficient-quality sensor data. Reliability improves with labeled training data, phase synchronization, multi-sensor confirmation, and ongoing validation against field inspection results.
Is 99% PD diagnostic accuracy realistic?
It can be realistic for specific laboratory datasets and defined defect categories. It should not be assumed for all field environments, assets, sensor arrangements, and noise conditions without demonstrated validation.
What data is needed for AI PD classification?
Useful data includes raw pulses, PRPD patterns, amplitude, phase angle, repetition rate, frequency spectrum, sensor timing, load, voltage, temperature, humidity, maintenance records, and confirmed defect labels.
Can AI distinguish PD from electrical noise?
Yes, especially when it compares waveform shape, phase correlation, frequency content, repetition behavior, and timing across multiple sensors. Difficult sites still require an engineer to review uncertain or high-risk classifications.
Can Wrindu provide OEM AI-ready PD diagnostic equipment?
Yes. Wrindu supports China factory-direct, custom, OEM, and wholesale PD diagnostic equipment requirements, including configurable sensor channels, data formats, reporting workflows, and technical application support.
Related articles
 SF6 Leak Detector Sensitivity: Select a Method for the Inspection TaskKnowledge
 Cable Fault Locator Selection for Urban Networks: Routes, Noise and AccessKnowledge
 Substation Battery Load Bank Sizing: Duty, Voltage Range and Heat RejectionKnowledge
 CT Polarity, Ratio and Burden Testing: Find Wiring and Loading ErrorsKnowledge