OVERVIEW
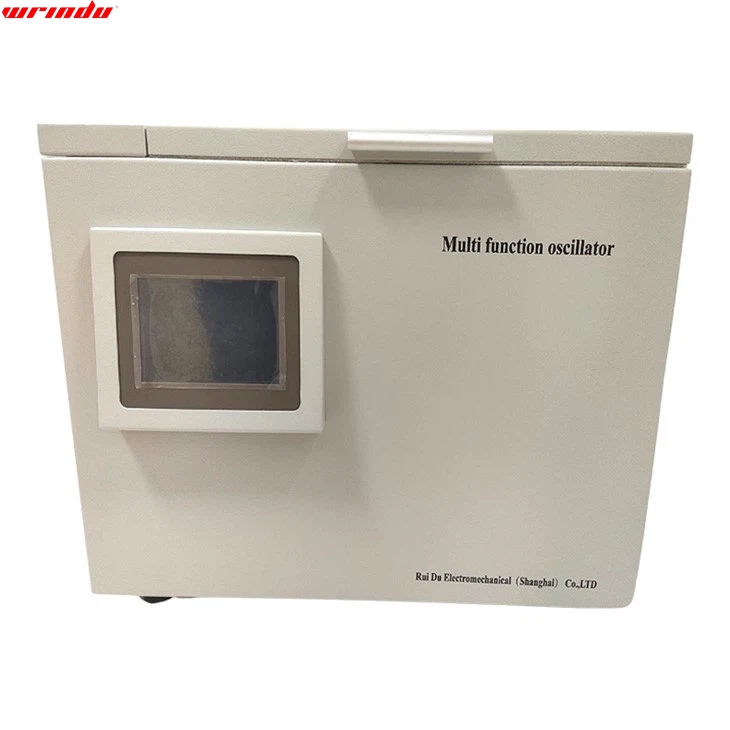
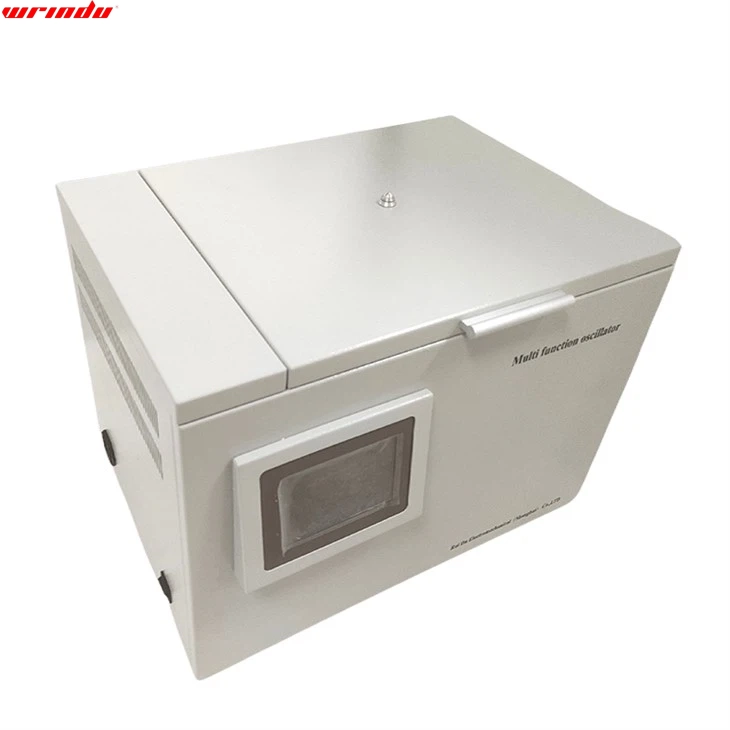
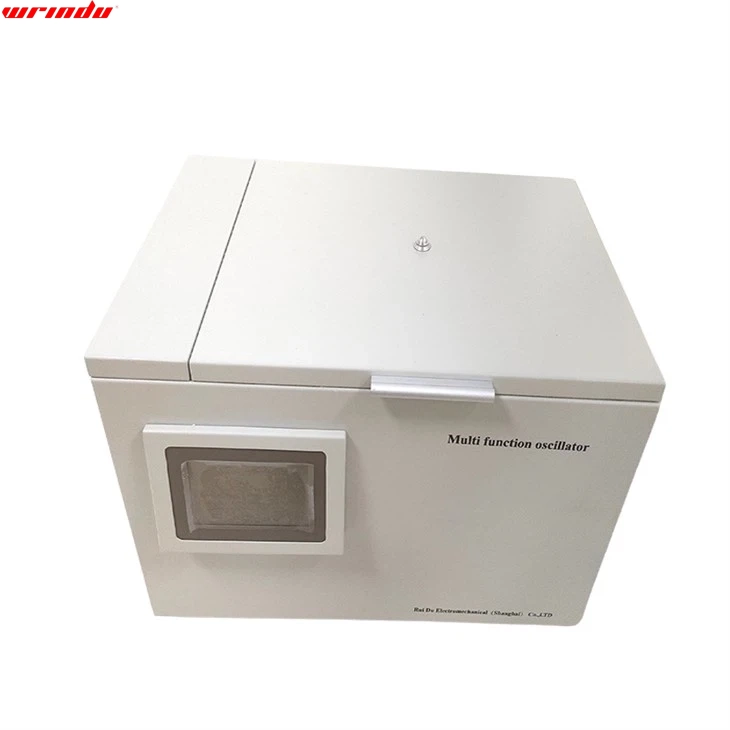
As a laboratory-specific analytical instrument, the multifunctional laboratory oscillator is mainly used for oscillation degassing of samples such as transformer oil. The device has a colour LCD touch interface, which supports real-time display and interactive operation of multiple parameters. Users can flexibly set the heating, oscillation and static time through custom modules to achieve parametric control of the test process. The laboratory oscillator integrates a microcomputer program control system and uses a PID intelligent algorithm to achieve high-precision temperature control. It has a compact size, lightweight design and low-noise operation characteristics. It has a built-in gas chromatography degassing unique program and a water-soluble acid mixing program. It supports a user-defined operation mode and meets diversified analysis scenarios’ standardised and personalised test needs.
CHARACTERISTIC
• Microcomputer control is adopted to achieve convenient human-computer interaction;
• Accurate temperature control ensures stable operation;
• Compact and light, low noise, more comfortable to use.
For more information about oil chromatograph, please click More.
To request the latest quotes, please click Contact Us.
FAQ
Q: What is the difference between an oscillator and an indicator?
A: The key difference between an oscillator and an indicator is that oscillators can stay at extreme levels (overbought or oversold) for long periods but cannot sustain a trend. On the other hand, indicators like the On-Balance-Volume (OBV) can trend continuously, either increasing or decreasing in value over an extended period.
Q: What is the principle of an oscillator?
A: An oscillator is an electronic device that operates on the principle of oscillation, where energy fluctuates periodically between two states. This periodic motion is used in various devices like computers, radios, clocks, watches, and metal detectors.
Q: What is an oscillator in technical analysis?
A: In technical analysis, an oscillator is a tool that creates a trend indicator by forming high and low bands between two extreme values. This indicator fluctuates within the bounds, helping traders identify short-term overbought or oversold conditions.


